Business Intelligence Tool – a more user-friendly interface, new features, and options for better monitoring and statistical analysis
As we mentioned in the previous article about Business Intelligence Tool it relies on creating and evaluating economic performance perspectives of energy efficiency for various user-defined scenarios.
For a better understanding and more user friendly interface, we’ve added new features and options.

After the user authentication or after creating the new account, the simulation
scenarios and their rules can be added. A new simulation scenario can be
created using the “Plus” button in the lower-right corner of the page
and by filling in the requested data: the name of the scenario, the estimated
value of the investment and the expected duration of the energy performance
contract.


A scenario can be edited or deleted using the two buttons in the upper left
corner.
Once the scenario has been created, the rules for the energy performance
contract will be added.

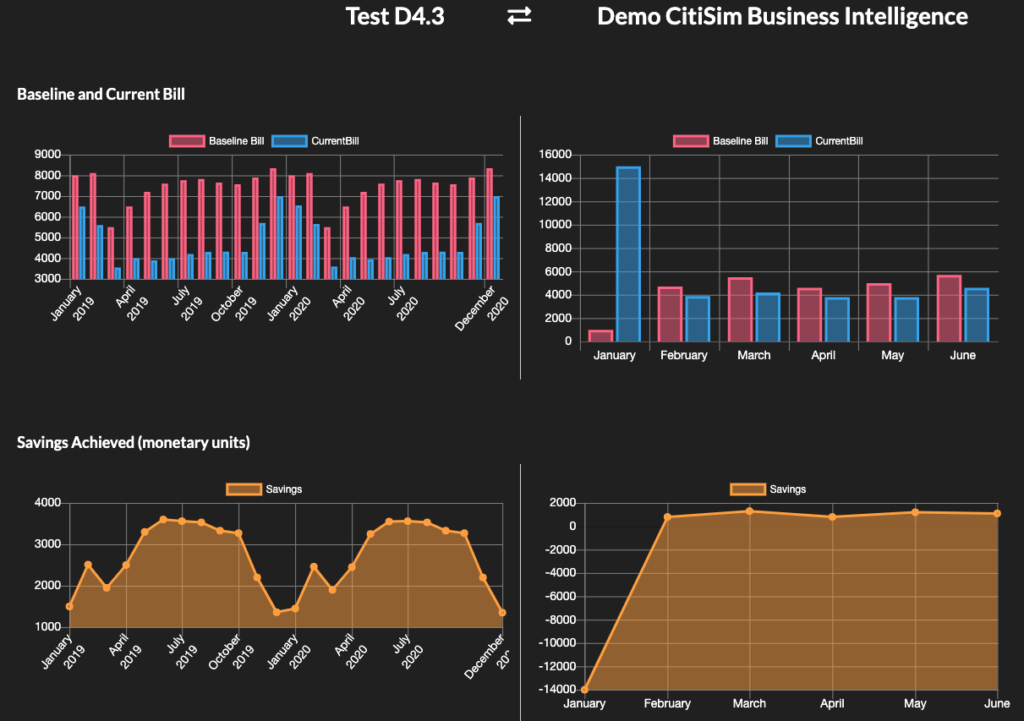
After the rules have been added by the user, information related to the average monthly consumption is obtained through the module for collecting and viewing data from the sensors or based on the billing history. The average monthly consumption is defined in the graphical interface of the application as “Baseline Bill”, that is the reference value. Using SAM (System Advisor Model), the value of the bill as a result of the investment (“Current Bill”) will be determined based on the weather conditions that characterize the region and on the basis of the energy demand. After entering the data on monthly average consumption and estimated output, the indicators describing the economic performance of the investment can be viewed in table format.

In addition to the table representation, the indicators can also be viewed in
the form of graphs. The created scenario can be compared to another scenario
using the “Compare Scenarios” option on the main application window.

Not only the table data be compared, but also the resulting graphs.
More information on the Business Intelligence Tool and other services developed within the CitiSim project, please access our YouTube channel (https://www.youtube.com/channel/UCrkOOwjFmvPujuVX6dosJBA?view_as=subscriber
Author: Teodora Usurelu
Company: Beia